Lab 3: Cellular Automata & Boolean Networks
ISE483/SSIE583: Evolutionary Systems and Biologically Inspired Computing

Assignment 3
- Chapter 2 in Floreano and Mattiussi [2008] Bio-Inspired Artificial Intelligence: Theories, Methods, and Technologies. MIT Press, and Carlos Gershenson provides a good Introduction to Random Boolean Networks. There is also a nice essay dealing with relationship to CA and meta-modeling considerations.
- Complete the following 3 problems, worth a total of 10 points. Points for each question are shown below for ISE483.
- Please submit your well-documented code as separate python files, one for each answer. Summarize your answers in a PDF document including program outputs and
figures, if any. Organize this document well, clearly indicating the question being answered and the respective Python file name(s). Upload all files into the 'Assignment 3' folder in Brightspace.
- Assignment is due before class on March 18th
Questions or problems? See email and office hours information.
The problems
- a) [2.5 points]
Write an elementary
(homogeneous, 1-dimensional lattice, binary, 3-cell neighborhood) cellular-automata simulator, that computes &
displays the time-evolution of any elementary CA from a given initial
configuration. Assume that the edges of your CA fold around (toroid lattice). Use
it to run Rule 126,
starting from an initial condition where the whole lattice is in state 0
except for a single point in the middle cell which is in state 1 (other rules are exemplified in section 2.4.1 of Floreano and Mattiussi's book and all rules can be seen at Wolfram's MathWorld). Run it for 100
iterations. Produce a space-time diagram that looks like the one shown for rule 126.
b) [2.5 points] Run the CA again, except now with a new rule (whichever one you like), and a random initial condition (the probability of each initial cell being on or off is 0.5)
- Implement the Boolean Network (BN) model of the mammalian cell cycle described in "Dynamical
Analysis of a Generic Boolean Model for the Control of the Mammalian
Cell Cycle", A. Faure, A. Naldi, C. Chaouiya, D. Thieffry, Bioinformatics, 2006, 22(14), pp. 124-131. PDF.
a) [2 points] Implement the transition logic for the 10-node BN described in Table 1 of the article (note that all the update functions that refer to the input as Ubc actually refer to UbcH10). The codewords under the column 'Product' are short for the regulatory molecules involved in the mammalian cell cycle. Run the network from an initial condition where the CycD node is set to OFF, and all other nodes are set to any state. Show that the fixed-state attractor reached is defined by: Rb = p27 = Cdh1 = ON, with all other nodes OFF. This state represents the quiescence state of the cell, as CycD is a key growth regulator; lack of it kills the cell cycle. Read the first 2 paragraphs of section 2.2 in the paper that explains this. Also, here is a sample program that implements a simple 2-node BN: BooleanNet.py
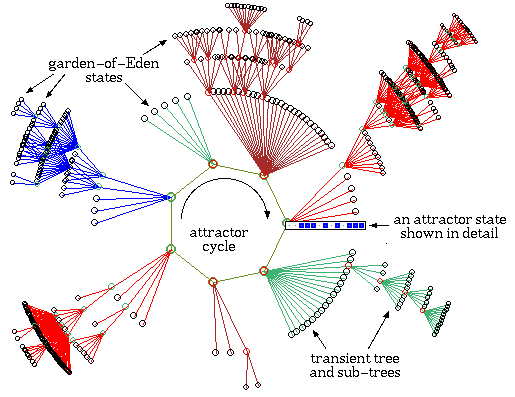
b) [3 points] Now set CycD node to ON. Using all possible combinations of states for the remanding nodes, create a state transition graph (STG) of this network (in other words, vertices in the STG represents all possible states of the network with CycD set to ON, and edges represent necessary transitions between these states). Plot this STG; note that this STG is not the same as the one shown on this webpage. You should see a 7-state cyclic attractor in your STG as shown in fig. 2 (bottom left) of the paper. To distinguish the attractor from the rest of the STG, write a piece of logic to identify it and then paint the nodes and edges involved in it using distinct colors. This attractor represents the active cell cycle, also explained in section 2.2 of the paper. To graph the STG, you will need to use a graph drawing library. A good one to use is the NetworkX library. For a sample piece of code on drawing a simple graph using this library, see BooleanNetSTG.py and DrawGraph.py.
- [Optional, extra 3 points] Write a 2-dimensional cellular-automata simulator, and implement the game of life. Its transition function is simple. Like the 1-dimensional CA in problem 1, this automaton is also binary with its two states often conceptualized as "alive" and "dead" with values 1 and 0, respectively. The state of each cell at the next iteration is determined by a set of 4 simple rules that you can find in the link above. Implement your CA on a 100x100 grid. Run it through a few hundred iterations from various initial conditions (the more the better). Describe the patterns you observe. Some example patterns have been observed in very large grids and documented. Note: you will not produce a space-time diagram for this, as it would have to be in 3D. Instead, simply show the state of your CA at the end of some of your runs. However, you have to pay attention the state of the CA at each iteration, in order to better observe and describe patterns as they evolve with time. A pair of useful examples using wxPython or PyCX can be found in those links.
Acknowledgements
- Lab prepared by Amahury Lopez Diaz, Samer Abubaker, Jessica Lasebikan, Samer Abubaker and Jack Felag, updated from original design by Artemy Kolchinsky and Santosh Manicka.
Last Modified: March 11, 2024