Lab 2: Lindenmayer Systems
ISE483/SSIE583: Evolutionary Systems and Biologically Inspired Computing
Topics
- Python Turtle documentation
- Turtle Demo
- Using turtle to draw L-systems: code snippets for rules without branching and with branching
- Demo by Group 1: notebook and zip file.
Assignment 2
- Read Sections 4.1, 4.2 in Floreano and Mattiussi [2008]. Bio-Inspired Artificial Intelligence: Theories, Methods, and Technologies. MIT Press.
- Complete the following 4 problems, worth a total of 10 points.
- Attach answers as separate Python files to your submission for 'Assignment 2' in Brightspace. Summarize your answers in a PDF document including figures, if any.
- You may find this applet useful for verifying your program output.
- Assignment is due before class on February 26th
Questions or problems? See our email and office hours information.
The problems
- [2 points] Generating words: Section 4.2 in Floreano and Mattiussi describes how an L-system re-writes words by iteratively applying a set of production rules, starting from a given axiom. See also Lecture 6. Implement an L-System algorithm as a Python function. Your function parameters should be: an axiom, a set of production rules, and the number of rewriting iterations. Then, call this function with axiom:= 'FX', a production_set:= {'X' : 'X+YF', 'Y' : 'FX-Y'} (in Python dictionary notation), and 5 maximum iterations. Print out the result.
- [2 points]
Drawing the words: Using turtle,
graph the words generated in problem 1, at each iteration. For this
problem, you will need to:
- Write a Python function which takes a character string, and
uses it to control a turtle pen. The character
Fshould move the pen forward by a certain distance,-should rotate the pen left by a preset δ degrees,+should rotate the pen right by δ degrees. All other symbols should be ignored. Remember that the turtle module in Python will not automatically recognize these symbols -- you need to implement them. - Graph the word produced by the L-system specified in problem 1, iterated at least 10 times, with δ = 90. Your picture should look like the "Dragon curve", famously used to open the chapters in Michael Crichton's Jurassic Park. Capture the picture generated in the last iteration and display it in your solution summary (in addition to the python file).
- Graph a different L-system axiom and production rule. Pick one either from de Castro's book, the Internet, or of your own invention. Use one that does not yet employ branching commands.
- Write a Python function which takes a character string, and
uses it to control a turtle pen. The character
- [2 points]
Drawing with branching:
Lindenmayer introduced the branching symbols '[' and
']' in production rules, to be able to draw plants more effectively.
Draw the two different "plants" defined by the following L-Systems:
- L-System 1: Axiom:= 'F', Production_set:= {'F' : 'F[+F][-F]F'}
- L-System 2: Axiom:= 'B', Production_set:= {'B' : 'F[-B] [+ B]', 'F' : 'FF'}
[and]initiate and close a branch, respectively. To initiate a branch, we push the current state of the Turtle (retrieved viaposition()andheading()) onto a stack of states. To close a branch, we pop a state off the top of the stack and use it to restore the position and heading of the turtle pen (viagoto()andsetheading()). Remember to raise the turtle pen before restoring the state, and to lower it afterwards (Hint: useup()anddown()).- The
Bcharacter (in L-System 2) serves as a budding point for branch development. Hence, it plays a role only in producing the words, and has no graphical interpretation. Your drawing can therefore ignore that character to draw the branching plant, and only interpret the standard turtle codesF, +, -(though you can optionally draw a distinct element forB). - [4 points] Drawing variety: Use the branching L-system code you have created to draw three different types of trees, taking their axioms and productions rules either from the book or the Internet. Remember to alter your angle δ -- most likely you will not want 90 degree rotations for trees. Use the branching L-system code you have created to draw a whole set of different trees, to be displayed simultaneously. In other words, draw a forest of L-system trees. The trees should be different from one another: for instance, you can code a set of different L-system axioms and production rules from which you pick randomly to draw different trees, or perhaps even the same tree with different attributes (in which case you should make sure that the symbols from different production sets match). Be sure to randomly vary your δ's within a certain range, so that the rotation angles of the trees differ from one another. This is a bit open-ended question, so you are free to explore.
- [Optional, extra 4 points]
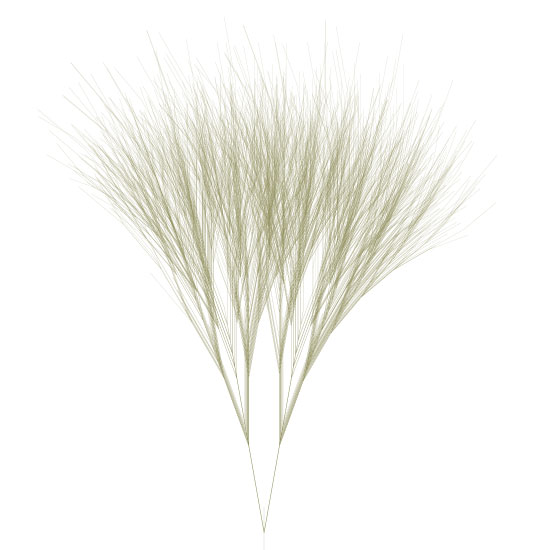
Modeling Arteries with Parametric L-systems: Arterial branching in organisms has been modeled with parametric L-systems. See formula (15) from this model:
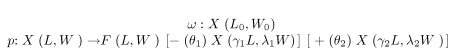
L0, W0, γ1, γ2, λ1, λ2, θ1 and θ2 are the parameters that need to be specified. They stand for the following: (1) L0, W0 represent the length and width of the initial branch segment, respectively; (2) γ1, λ1 and θ1 represent, respectively, the factors by which the length of the left branch scales, the factor by which the width of the left branch scales, and the counter-clockwise angle by which the left branch rotates, relative to its parent branch; (3) γ2, λ2 and θ2 represent, respectively, the factors by which the length of the right branch scales, the factor by which the width of the right branch scales, and the clockwise angle by which the right branch rotates, relative to its parent branch. The paper describes simple formulae (11, 12, and 13) to specify the above parameters themselves (except L0 and W0 that you are free to choose) with a single parameter α that varies from 0.0 to 1.0. These formulae are derived from the natural assumptions that wider arteries should conduct more blood flow, and that when an artery branches out the total flow should be conserved. The objective of this model is to simulate real arteries, by specifying various parameter values. Implement this model, playing with different parameter values and check if your pictures match those in the paper (Fig.8). Compare them with the pictures of real arteries (Fig.9), and discuss some of the limitations of using an L-system to mimic reality (think of the Hertz modeling scheme). Do you think that the extent of asymmetry and variety in real arteries can be fully matched?
Acknowledgements
- Lab prepared by Samer Abubaker, Jack Felag, Yoshiaki Fujita, and Akshay Gangadhar, updated from original design by Artemy Kolchinsky and Santosh Manicka.
Last Modified: February 18, 2024